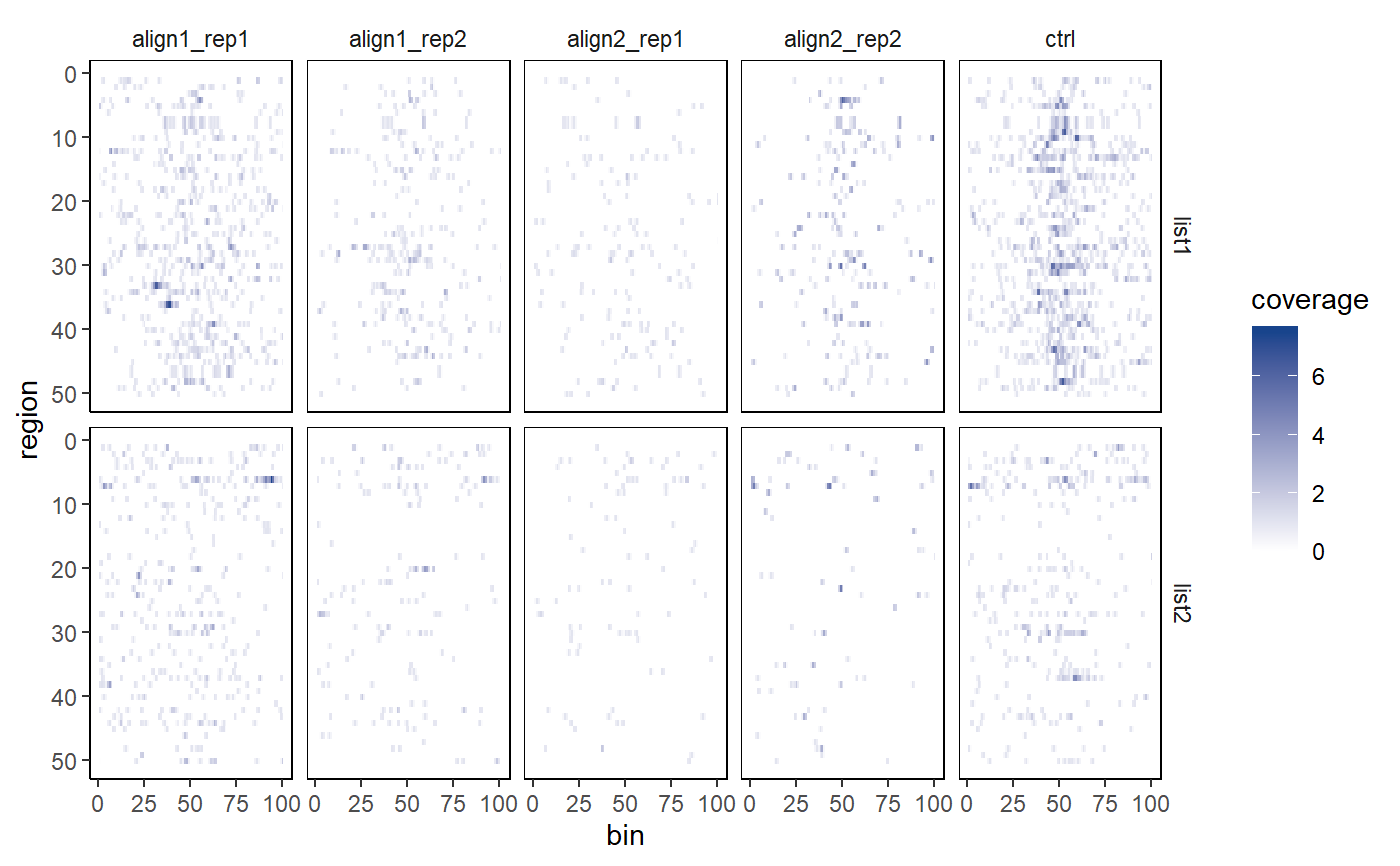
Plots a heatmap of coverages from a metagene2 object.
Source:R/heatmap_from_metagene.R
metagene2_heatmap.RdThis function creates an ordering of regions within region groups based on
ascending or descending mean coverage. This is used with the
metagene2_heatmap function.
metagene2_heatmap(metagene, region_order = as_is_region_order(metagene))
Arguments
| metagene | The metagene object to be plotted as a heatmap. |
|---|---|
| region_order | A named list with as many elements as there are region
groups, with each element containing an ordering for the
regions within that group.
The |
Value
A ggplot object containing a heatmap representation of the metagene2 object.